2. School of Aerospace, Tsinghua University, Beijing 10084, China
2. 清华大学 航天航空学院,北京 100084
Rotor components, which are exposed to high pressures, severe thermal environments, are one of the most important components of modern gas turbines. However, component overheating can significantly damage the reliability and working lives of these rotors, so they must be carefully designed. In the conceptual design phase, after the determination of the rotor material, structural model(disc/drum type), and 2-D profile, the structure is optimized to strengthen the rotor structure, lighten the rotor weight. As a result, designing need fast and accurate methods to predict the temperature distribution.
The heat transfer in the turbine rotor can be divided into three parts. They are heat transfer from the main gas flow to the turbine blade; from the turbine blade to the turbine disc; from the solid structure(blade and disc)to the coolant(cooling air and oil). 3D CFD models of the gas/cooling flow have dramatically improved in recent years. 2-D/3-D coupled fluid-solid simulations can accurately predict the heat transfer of internal flows in gas turbine[1~5]. However, the complex structures, complicated domain topology and very large mesh element number make these approaches so time consuming that they are not appropriate for the conceptual design stage. Several measures have been taken to reduce the calculation time scale[6, 7]. Ko and Rhode [8] simplified the disc and adjacent cavities to 2-D axial symmetry shapes, Zhang et al [9] simplified the internal cooling tubes to a 1-D network that provides boundary conditions to a 3-D blade model, Yannick [10] and Guo et al[11] modeled the coupled heat transfer between the internal 1-D secondary air system(SAS)flow network and the 2-D disc. This studies improved the prediction accuracy and efficiency, but there are no studies modeling all three parts together, and can quickly predict the entire rotor temperature field.
In this study, the coupled main stream-rotor-secondary air environment in gas turbines is modeled numerically. The results show reasonable agreement with experimental data. The predicted temperature fields are more accurate than these predicted by an uncoupled method, which shows the effectiveness and efficiency of this method.
2 GeometryThe thermal environment around a full scale high pressure turbine(HPT)rotor was modeled by a quick, accurate algorithm to calculate the temperature distribution in the rotor as well as the SAS flow characteristics. For the rotor shown in Fig. 1, main stream gas flows between the blades to drive the high pressure rotor to rotate. The blades are attached to the disk rim by the dovetail slots, which are cooled by secondary air flow from front side of the turbine disc. This flow prevents the disc rim from overheating by the ingress gas.

|
Fig. 1 Thermal environment around a HP turbine rotor |
Temperature predictions were carried out by using 4 different solvers. Each solver calculates one heat transfer problem(Table 1). These solvers have been developed previously, except for the 2-D heat conduction solver used to calculate the 2-D temperature field of the rotor.
|
|
Table 1 Heat transfer solvers |
Summary of the solvers are shown in Table 1.
A 2-D finite difference method is used to solve the energy balance equation when predicting the disc and shaft temperature fields.
The energy balance for a 2-D boundary element "i"is:
| $ \sum\limits_{\mathit{j}{\rm{ = 1}}}^\mathit{N} {{\mathit{\lambda }_{\mathit{ij}}}} \frac{{{\mathit{T}_\mathit{j}}{\rm{ - }}{\mathit{T}_\mathit{i}}}}{{{\mathit{d}_{\mathit{ij}}}}}{\mathit{A}_{\mathit{ij}}}{\rm{ + }}\sum\limits_{\mathit{i}{\rm{2 = 1}}}^{\mathit{N}{\rm{2}}} {{\mathit{Q}_{\mathit{i}{\rm{2}}}}} {\rm{ + }}\sum\limits_{\mathit{i}{\rm{3 = 1}}}^{\mathit{N}{\rm{3}}} {{\mathit{h}_{\mathit{i}{\rm{3}}}}{\mathit{A}_{\mathit{ii}{\rm{3}}}}} {\rm{(}}{\mathit{T}_{\mathit{i}{\rm{3}}}}{\rm{ - }}{\mathit{T}_\mathit{i}}{\rm{) = 0}} $ | (1) |
Tj :temperature of the adjacent element; this item calculate the heat conduction with the adjacent elements.
Qi2 : heat source of element i; this item calculate the total heat source of the element.
hi3 : convective heat transfer coefficient of the boundary on element i; this item calculate the total convective heat transfer of the element.
The equations are solved for all the elements of the 2-D domain. Test case for a theoretical heat conduction model showed the solvers are in coincidence with the analytic solution.
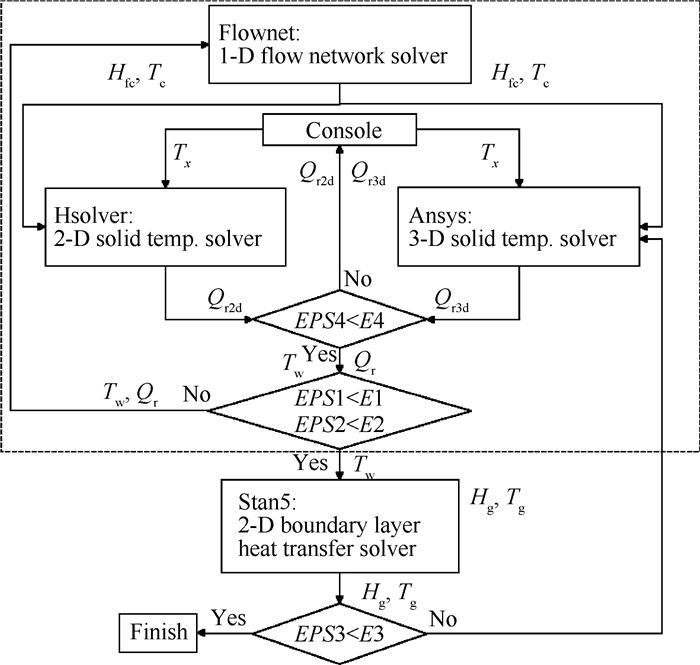
3.2 Coupling methodologyThe convergence criteria(EPS)for coupled problems are shown in Table 2. The heat transfer boundary between the shaft component and the lubricant oil is taken as constant uniform boundary. Fig. 2 shows a schematic of the convergence criteria.
|
|
Table 2 Summary of iterative convergence criteria |
|
Fig. 2 Schematic representation of the computing process |
As shown in Fig. 2, the 2-D/3-D solid heat conduction solver reads in the flow temperatures and the convective heat transfer coefficients from the 1-D flow network results. The 1-D flow network solver reads in the 2-D solid wall temperatures and the heat flows(Qr) from the 3-D solid domain.
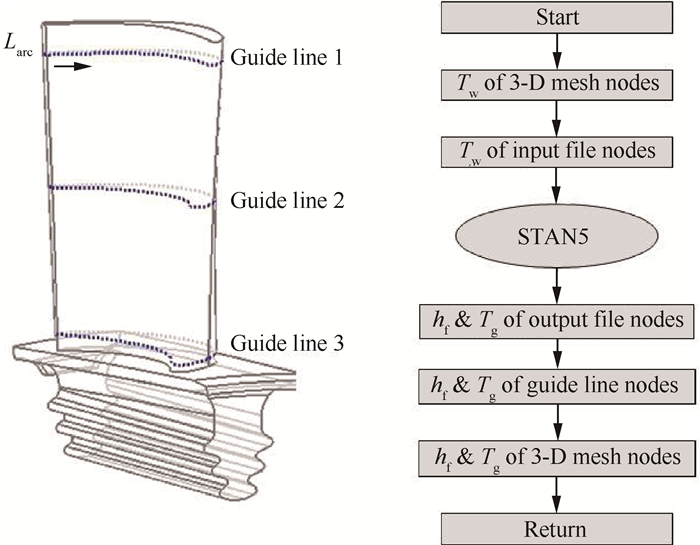
3.2.2 Coupling between the 3-D solid domain and the 2-D main stream boundary layerThe Stan5 solver [12] calculates the heat transfer boundary at the interface between the main stream and the solid blade, except for the tip and platform surfaces of the blade. These two surfaces were calculated using empirical relations and remained constant during the iteration.
3.2.3 Energy balance between the 2-D and 3-D solid domainsThe turbine blade and disc rim contact each other at the dovetail slot. Thus, the contact surface temperatures were iterated until the heat transfer rates and temperatures at the contacting surfaces were equal.
| $ {\mathit{T}^{{\rm{(}}\mathit{n}{\rm{ + 1)}}}}{\rm{ = }}{\mathit{T}^{{\rm{(}}\mathit{n}{\rm{)}}}}{\rm{ + }}{\mathit{F}^{{\rm{(}}\mathit{n}{\rm{)}}}} \cdot {{\rm{(}}{\mathit{Q}_{{\rm{r2d}}}}{\rm{ + }}{\mathit{Q}_{{\rm{r3d}}}}{\rm{)}}^{{\rm{(}}\mathit{n}{\rm{)}}}} $ | (3) |
| $ {\mathit{F}^{{\rm{(}}\mathit{n}{\rm{)}}}}{\rm{ = }}\frac{{{{{\rm{(}}{\mathit{Q}_{{\rm{r2d}}}}{\rm{ + }}{\mathit{Q}_{{\rm{r3d}}}}{\rm{)}}}^{{\rm{(}}\mathit{n}{\rm{)}}}}{\rm{ + (}}{\mathit{Q}_{{\rm{r2d}}}}{\rm{ + }}{\mathit{Q}_{{\rm{r3d}}}}{{\rm{)}}^{{\rm{(}}\mathit{n}{\rm{ - 1)}}}}}}{{{\rm{2(}}{\mathit{T}^{{\rm{(}}\mathit{n}{\rm{)}}}}{\rm{ - }}{\mathit{T}^{{\rm{(}}\mathit{n}{\rm{ - 1)}}}}{\rm{)}}}}{\rm{ + }}\frac{{{\mathit{F}^{{\rm{(}}\mathit{n}{\rm{ - 1)}}}}}}{2} $ | (4) |
Fig. 4 shows the temperature field in the 3-D blade. The highest temperature is 1128K and the lowest temperature is 913K. The temperatures are higher along the mid-span and lower at the tip and root. The temperatures of the three interfaces at the dovetail slot are 934.9K, 925.5K and 914.0K.

|
Fig. 4 Temperatures in the 3-D Domain |
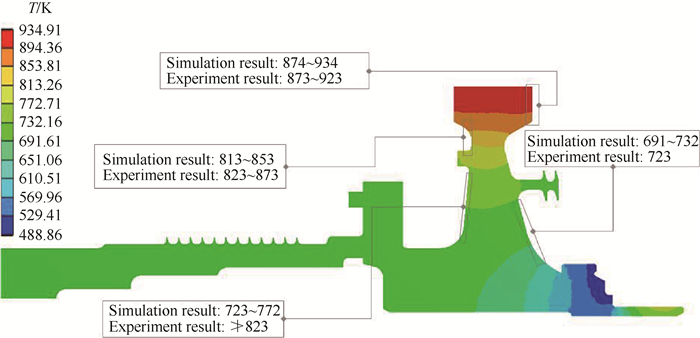
Fig. 5 shows the temperature field of the 2-D disc and shaft. The wall temperatures on the front of the disc, in the mid radius region are 813~853K, while the experimental results are 823~873K, the predicted temperature on the disc center region are 723~772K while the measured temperatures are less than 823K. The wall temperatures on back of the disc in the rim region are 874~934K while the measured temperatures are 873~923K, the predicted temperatures in the center parts are 691~732K while the measured temperatures is 723K. Thus, the simulations agree reasonably well with the experimental data. The average temperature error is about 30~40K. The biggest error is on the disc center region, a rotor-rotor system with protruding bolts located in front of the HPT disc. The heat transfer coefficient of the disc surface is a function of Cw(Swirl ratio), which is manual specified(Cw=0.5)in this cavity. This value will overestimate the cooling effect in the rotor-rotor system.
|
Fig. 5 Temperatures in the 2-D Domain |
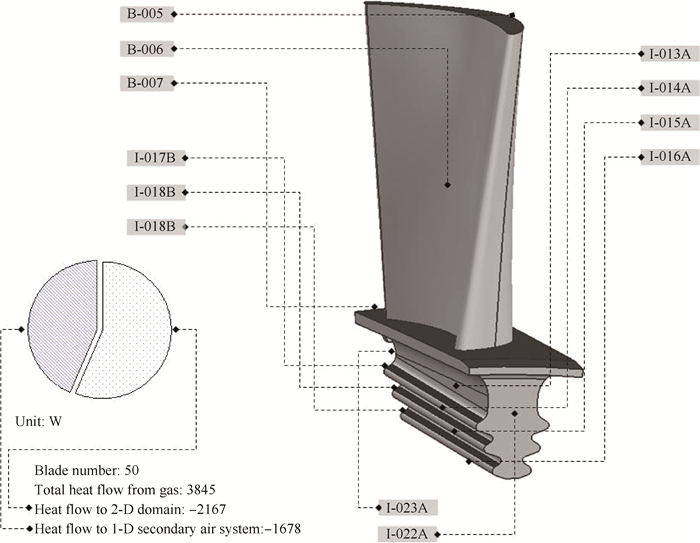
The heat flow distribution in the blade is shown in Fig. 6. The total heat transfer from the gas to the blade is 3.84kW, 56.4% of which was conducted to the disc rim with the rest absorbed by the cooling flow through the clearance of dovetail slot. Thus, the cooling air significantly reduces the heat transfer through the dovetail slot.
|
Fig. 6 Heat flow distribution in the HP blade |
Fig. 7 shows the heat flows across the blade boundaries. The blade absorb heat from boundaries(B-005~B-007)which are in contact with the gas. The boundary B-006, which represents the blade body, absorbs 95.6% of the total absorbed heat. The boundaries releasing heat are the solid-solid interface(I-017B~I-019B) and the clearance air cooling interface (I-013A~I-016A, I-022A, I-023A). Fig. 7 indicates that I-017B losses more than 50% of the heat transfer through the three solid-solid interface.

|
Fig. 7 Heat flows at the 3-D thermal boundaries(single blade) |
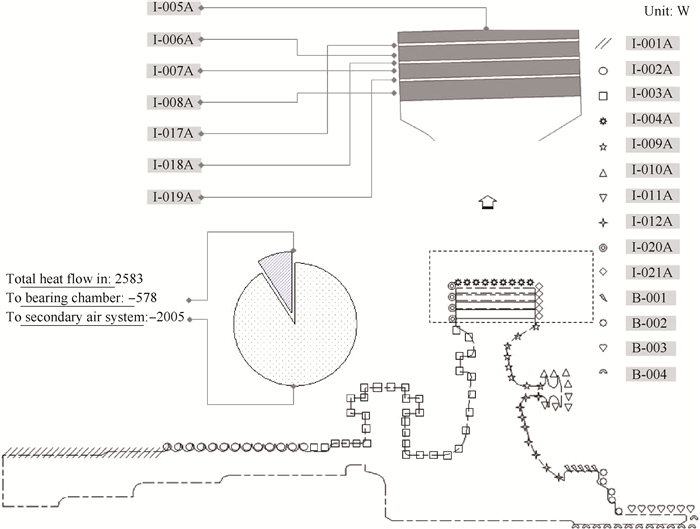
The heat flow distributions on the disc and shaft are shown in Fig. 8. The total heat flow from the blades to the 2-D domain is 2.58kW, 77.9% of which is conducted to the SAS coolant air while the rest is absorbed by the oil in the bearing chamber.
|
Fig. 8 Heat flow distributions in the HP disc and shaft |
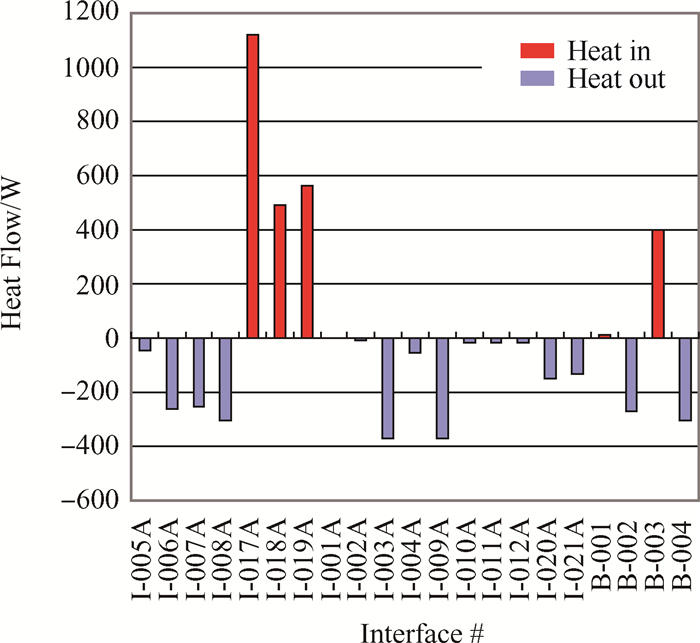
Fig. 9 shows the heat flow across the disc and shaft boundaries. For the fourteen SAS related boundaries, the clearance air cooling boundaries (I-005A~I-008A) account for 43.4% of total heat absorption. 18.5% of the heat transferred to the front disc cavity and 18.4% transferred to the rear disc cavity. The total heat transfer through the four lubrication boundaries (B-001~B-004)is -165W. B-001 stands for the circumferential seal heat source. B-003 stands for the bearing heat source. B-002 and B-004 stand for the cooling by the oil in the bearing chamber. The total heat absorbed by the oil is -578W.
|
Fig. 9 Heat flows along of the 2-D heat boundary |
The effect of the coupling at the fluid-solid boundary is also shown by comparing the adiabatic mode and the full coupled mode. For full coupled mode, EPS1, EPS2, EPS3 iterations are used to make sure the energy is balanced on both sides of the fluid-solid interface.
For SAS adiabatic mode, EPS1 and EPS2 iteration are suppressed. The Flownet solver calculates the heat transfer coefficient using the assumed wall temperature (assume Tw equals Tlimiting of the material) as the reference temperature. During the calculation, heat transfer coefficients of the SAS boundary remain constant.
The main stream adiabatic mode means EPS3 iteration is suppressed, and the Stan5 solver calculates the heat transfer coefficient using the adiabatic wall temperature(Taw=Tg + rug2/(2cp))as the reference temperature. During the calculation, heat transfer coefficients of the main stream boundary remain constant. Only the coupling with the SAS is considered.
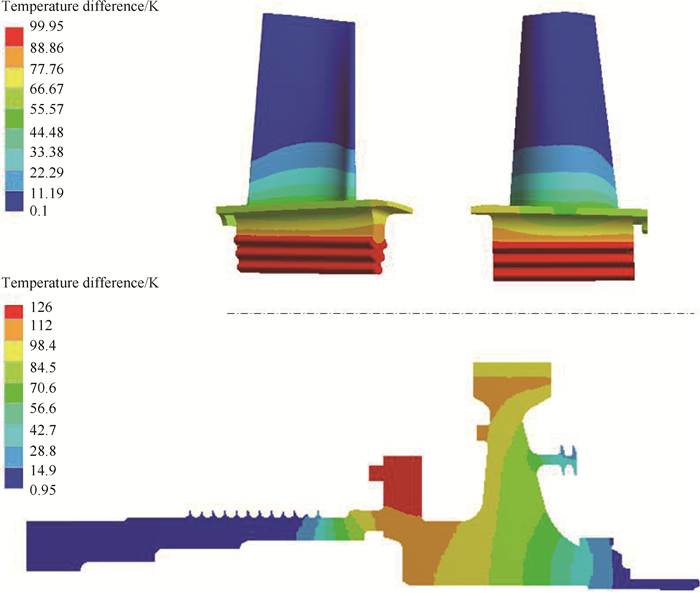
Fig. 10 shows the temperature difference between the SAS adiabatic mode and the full coupled mode. The figure indicates that the value of the differences(Tad mode-Tfull mode)are positive. This is because the initial boundary temperature of the SAS flow element(such as tube, hole, cavity, etc) was specified artificially. The initial temperature is the solid material's limiting temperature. This will cause more temperature rise of the flow element. The boundary temperature of the solid domain would be overestimated.
|
Fig. 10 Temperature differences between SAS adiabatic mode and the full coupled mode |
The maximum difference is 126K, next to the slot joint of the HPT disc and shaft. This joint is in the coolant flow in the front cavity, where the mass flow rate is higher. The temperature difference is approximately 0 in the blade body and the domain near the rear bearing chamber where the heat transfer is strongly affected by the main stream and the lubricant boundaries. Thus, the coupling at the SAS boundary must be taken into account when predicting the heat transfer in the turbine rotor environment.
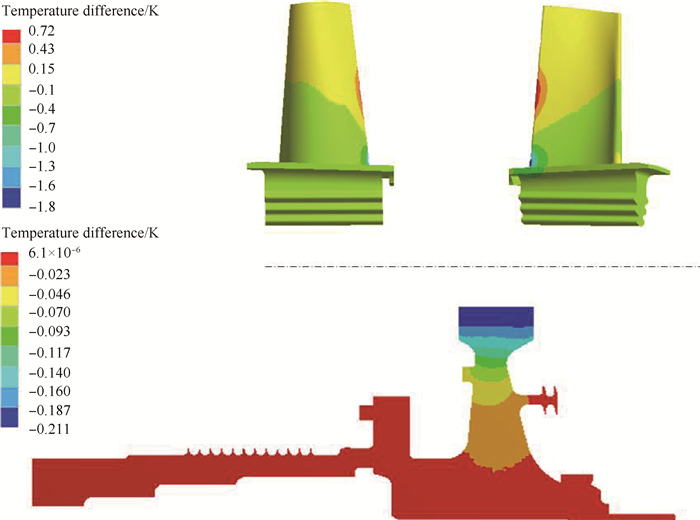
Fig. 11 shows the temperature difference between the main stream adiabatic mode and the full coupled mode. The difference is much smaller than in Fig. 10. The maximum value is 1.8K. This indicates the weak relationship between the wall heat transfer coefficient and the wall temperature. This is because the turbine blades are non-cooling blades, there are little temperature difference between the solid surface and the flow. Thus, for the non-cooling blade, the coupling at the main stream boundary is not necessary.
|
Fig. 11 Temperature difference between main stream adiabatic mode and the full coupled mode |
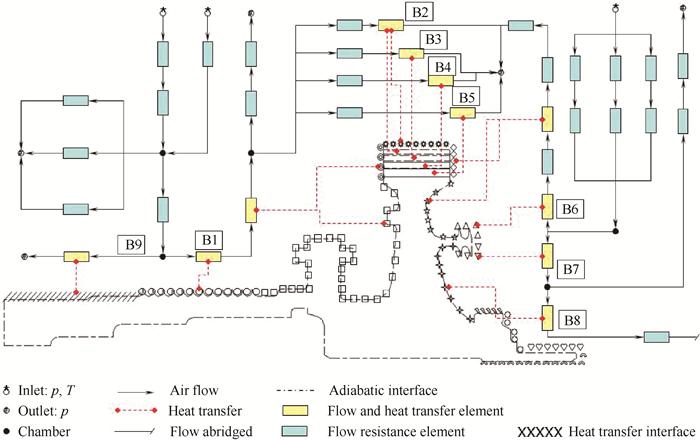
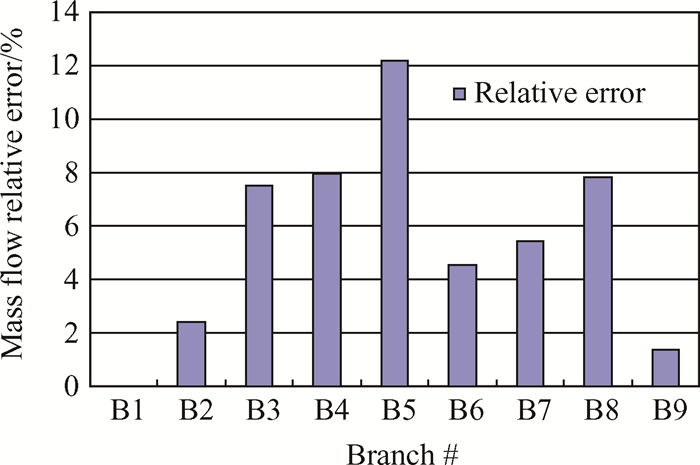
The SAS flow branch locations are shown in Fig. 12. Mass flow distribution was studied for the SAS boundary coupled and uncoupled mode.Fig. 13 shows the relative mass flow rate errors(abs(Madia mode-Mfull mode) /Mfull mode)in the nine branches which have flow elements that coupled with the solid boundaries. Most of the errors in Fig. 13 are around 5%. The maximum value is 11%. This result indicates the importance of the coupling when calculating the SAS mass flow rate.
|
Fig. 12 Configuration of SAS flow branches |
|
Fig. 13 Relative errors of the SAS branch mass flow rates between SAS adiabatic mode and the full coupled mode |
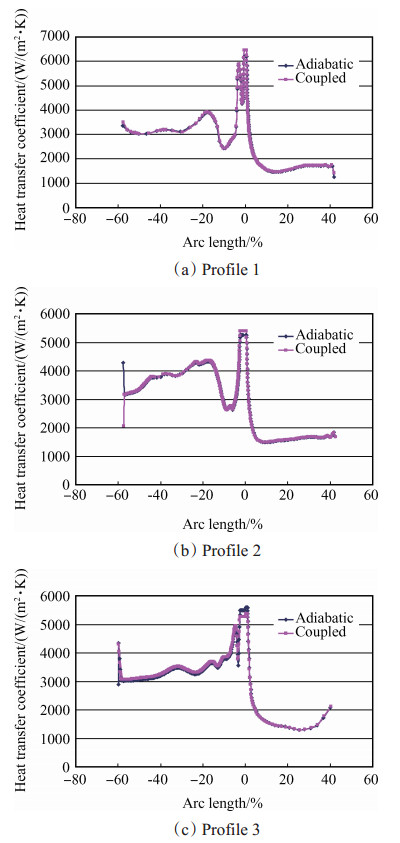
Fig. 14 shows the heat transfer coefficient distributions along the three spanwise profiles of the blade in Fig. 3 for the main stream adiabatic mode and the full coupled mode. The heat transfer coefficient are all quite similar since there are little temperature variations between the solid surface and the main gas flow. Heat transfer coefficients are a little larger in the coupled mode than in the adiabatic mode which leads to the positive temperature differences value in Fig. 11. However, the situation is revised in some small areas. The heat transfer coefficient near the trailing edges of profile 2 and profile 3 predicted by the coupled mode are quite different from those predicted by the adiabatic mode, but the temperature difference in those areas are still quite small. Heat transfer coefficient variations of 1000~2000W/ (m2·K)lead to wall temperature difference of only -1.8~0.72K.
|
Fig. 14 Heat transfer coefficient along profile 1~3 for main stream adiabatic mode and the full coupled mode |
|
Fig. 3 Boundary condition mapping on the blade surface |
The time for solving the entire case is less than 3 hours, so this algorithm is very useful for the conceptual design process with uncertain dimensions and frequent changes. However, during the technical design phase, the algorithm given here is not sufficiently accurate. Several measures should be taken to improve the accuracy. Table 3 shows the typical algorithms and the computational times.
|
|
Table 3 Computational times for the various approaches |
A multidimensional coupled heat transfer procedure has been developed to calculate the thermal and flow characteristics of the hot gas-turbine structurecooling air environment in a full scale turbine rotor. The results show reasonable agreement with experimental data. The average temperature error is 30~40K.
Cooling air through the clearance in the dovetail removes 44% of heat conducted down from the main gas stream. The rest is transferred to the disc rim with 20% of which goes to the rear bearing chamber, 40% also goes to the cooling air through the clearance between the dovetail and the remained transfers to other cooling surfaces.
The influence of the coupling was evaluated by calculating the adiabatic mode and the coupled mode. The results show that for the non-cooling turbine blade, wall temperature iteration is useless. Heat transfer coefficient can be separately calculated.
However, for the heat transfer between the cooling air flow and the turbine disc, the results show that the wall temperature strongly affects cooling air mass flow rate with a maximum relative difference of 10% between the coupled mode and adiabatic mode. The maximum wall temperature error reaches 120K, which indicates that the coupling between the cooling air flow and the solid domain is necessary.
| [1] |
Ralf S, Sigmar W. Gas Turbine Heat Transfer: Past and Future Challenges[J]. Journal of Propulsion and Power, 2000, 16(4): 583-589. DOI:10.2514/2.5611
(  0) 0) |
| [2] |
Maffulli R, He L. Wall Temperature Effects on Heat Transfer Coefficient for High-Pressure Turbines[J]. Journal of Propulsion and Power, 2014, 30(4): 1080-1090. DOI:10.2514/1.B35126
(  0) 0) |
| [3] |
Douglas L S, Daniel J D. Simulation of Coupled Unsteady Flow and Heat Conduction in Turbine Stage[J]. Journal of Propulsion and Power, 2000, 16(6): 1141-1148. DOI:10.2514/2.5689
(  0) 0) |
| [4] |
Roger L D, John P C. Conjugate Design/Analysis Procedure for Film-Cooled Turbine Airfoil Sections[J]. Journal of Propulsion and Power, 2011, 27(1): 61-70. DOI:10.2514/1.48451
(  0) 0) |
| [5] |
罗磊, 卢少鹏, 迟重然, 等. 气热耦合条件下涡轮动叶叶型与冷却结构优化[J]. 推进技术, 2014, 35(5): 603-609. (LUO Lei, LU Shao-peng, CHI Zhon-gran, et al. Conjugate Heat Transfer Optimization for Blade Profiles and Cooling Structure in Turbine Rotor[J]. Journal of Propulsion Technology, 2014, 35(5): 603-609.)
(  0) 0) |
| [6] |
Majumdar A, Ravindran S S. Numerical Prediction of Conjugate Heat Transfer in Fluid Network[J]. Journal of Propulsion and Power, 2011, 27(3): 621-630.
(  0) 0) |
| [7] |
James R R. Flownet: A Computer Program for Calculating Secondary Flow Conditions in a Network of Turbomachinery[R]. NASA TM-73774.
(  0) 0) |
| [8] |
Ko S H, Rhode D L. Disk Temperature Details of Rim Seal Turbulent Heat Diffusion and Disk Frictional Heating[J]. Journal of Propulsion and Power, 1999, 15(2): 280-287. DOI:10.2514/2.5424
(  0) 0) |
| [9] |
张丽, 刘松龄, 朱惠人. 涡轮叶片尾缘扰流柱通道流动换热计算[J]. 推进技术, 2010, 31(5): 593-598. (ZHANG Li, LIU Song-ling, ZHU Hui-ren. Computation for the Flow and Heat Transfer Properties of a Pin Fin Duct[J]. Journal of Propulsion Technology, 2010, 31(5): 593-598.)
(  0) 0) |
| [10] |
Yannick M. Integrated Fluid Network-Thermomechanical Approach For the Coupled Analysis of a Jet Engine [R]. ASME GT 2009-59104.
(  0) 0) |
| [11] |
郭晓杰, 顾伟, 竺晓程, 等. 航空发动机热端部件二次流动和传热耦合方法研究[J]. 燃气轮机技术, 2014, 27(2): 40-45. (  0) 0) |
| [12] |
Crawford M E, Kays W M. STAN5 -A Program for Numerical Computation of Two-Dimensional Internal and External Boundary Layer Flows[R]. NASA Contractor Report, 2742.
(  0) 0) |
| [13] |
杨世铭, 陶文铨. 传热学[M]. 北京: 高等教育出版社, 2006.
(  0) 0) |
| [14] |
吴丁毅. 内流系统的网络计算法[J]. 航空学报, 1996, 17(6): 653-657. (  0) 0) |
| [15] |
Majumdar A, Katherine P V. A General Fluid System Simulation Program to Model Secondary Flows in Turbomachinery[R]. AIAA 95-2969.
(  0) 0) |
| [16] |
Dario A, Nicholas J H, Christopher J B. Thermo-Mechanical Finite Element Analysis/Computational Fluid Dynamics Coupling of an Interstage Seal Cavity Using Torsional Spring Analogy[J]. Journal of Turbomachinery, 2012, 134.
(  0) 0) |
| [17] |
Sun Z X, John W C, Nicholas J H, et al. Coupled Aerothermomechanical Simulation for a Turbine Disk Through a Full Transient Cycle[J]. Journal of Turbomachinery, 2012, 134.
(  0) 0) |
| [18] |
Behnam N, Arnold K, Knut L. Interdisciplinary Analysis of a Turbine Blade with Internal Cooling Including Local Distribution and Rotation Effects[R]. AIAA 2014-2388.
(  0) 0) |
 2018, Vol. 39

